Tutorial · 3 min read
State-Space-Grid Analysis with INTERACT: Visualizing Dyadic Interactions
Learn how to use INTERACT's State-Space-Grid to visualize and analyze co-occurrences between two categorical variables synchronized in time.
Introduction
The State-Space-Grid is a powerful analytical tool in INTERACT that allows researchers to visualize dynamic interactions between two categorical variables. This tutorial demonstrates how to create graphical landscapes of dyadic interactions, showing all co-occurrences between two behavior classes and helping identify patterns in synchronized behavioral data.
What You’ll Learn
- Set up and configure State-Space-Grid analysis for dyadic data
- Interpret visual representations of co-occurring behaviors
- Navigate between different classes and adjust display parameters
- Extract statistical measures from grid patterns
- Use timeline controls to analyze behavioral changes over time
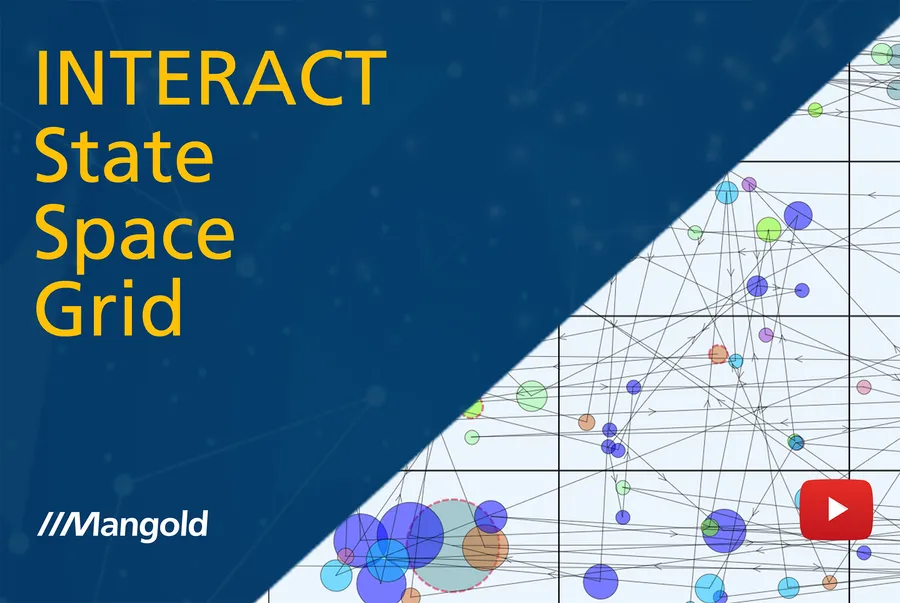
Video Tutorial
Tutorial Overview
This comprehensive tutorial introduces the State-Space-Grid as an analytical tool for visualizing relationships between two categorical variables that are synchronized in time. The State-Space-Grid creates a graphical landscape of dyadic interactions by displaying all co-occurrences between two behavior classes, making it particularly effective for identifying dynamic interaction patterns.
The tutorial begins by explaining the data requirements for State-Space-Grid analysis. Your data file must contain at least two class columns with data, and it’s crucial that events with codes from the same class do not overlap in time. We demonstrate this using a demo file containing data of two dogs in different areas performing various activities like walking, eating, drinking, and scratching. The position of each dog is logged continuously in the ‘Area’ class, while behaviors are recorded in the ‘Activities’ class, with codes being mutually exclusive within each class but overlapping across classes.
We explore how the same data appears completely different when viewed on a traditional timeline versus the State-Space-Grid representation. The tutorial guides you through accessing the State-Space-Grid from the Analysis tab’s Dyadic section, configuring the analysis parameters, and selecting appropriate DataSets. The grid visualization shows co-occurrences as circles positioned where rows and columns intersect, with circle size representing the duration of overlaps.
The tutorial covers advanced features including switching between different class pairs, handling data gaps, interpreting statistical measures through the Statistics Grid tab, and using timeline controls to analyze behavioral changes over specific time periods. We demonstrate the playback feature for observing how interactions evolve over time and explore various customization options for colors, opacity, and visual elements.
Finally, we examine the practical applications of cell selection for focused analysis, data export capabilities, and the Events tab structure. The tutorial emphasizes how the State-Space-Grid creates new events based on overlaps rather than original event boundaries, providing a unique perspective on behavioral data that complements traditional analysis methods and offers researchers powerful insights into dynamic interaction patterns.
INTERACT: One Software for Your Entire Research Workflow
From data collection to analysis—including GSEQ integration—INTERACT has you covered.