Tutorial · 2 min read
Descriptive Statistics in INTERACT: Comprehensive Data Analysis Tutorial
Master INTERACT's built-in descriptive statistics capabilities to analyze behavioral data with frequency, duration, and interval-based reporting tools.
Introduction
Discover INTERACT’s powerful built-in descriptive statistics capabilities that automatically generate comprehensive behavioral data analysis. This tutorial demonstrates how to leverage various statistical reports and visualization tools to gain insights from your coded behavioral data using INTERACT’s versatile analysis features.
What You’ll Learn
- Navigate INTERACT’s comprehensive statistics menu and reporting options
- Generate frequency, duration, and percentage-based behavioral analysis reports
- Create interval-based statistics for time-segmented data analysis
- Utilize cross-tabulated data views for enhanced data interpretation
- Export statistical results to Excel and other formats for further analysis
Video Tutorial
Tutorial Overview
This comprehensive tutorial explores INTERACT’s extensive descriptive statistics capabilities, demonstrating how behavioral research data transforms into meaningful analytical insights through automated statistical reporting.
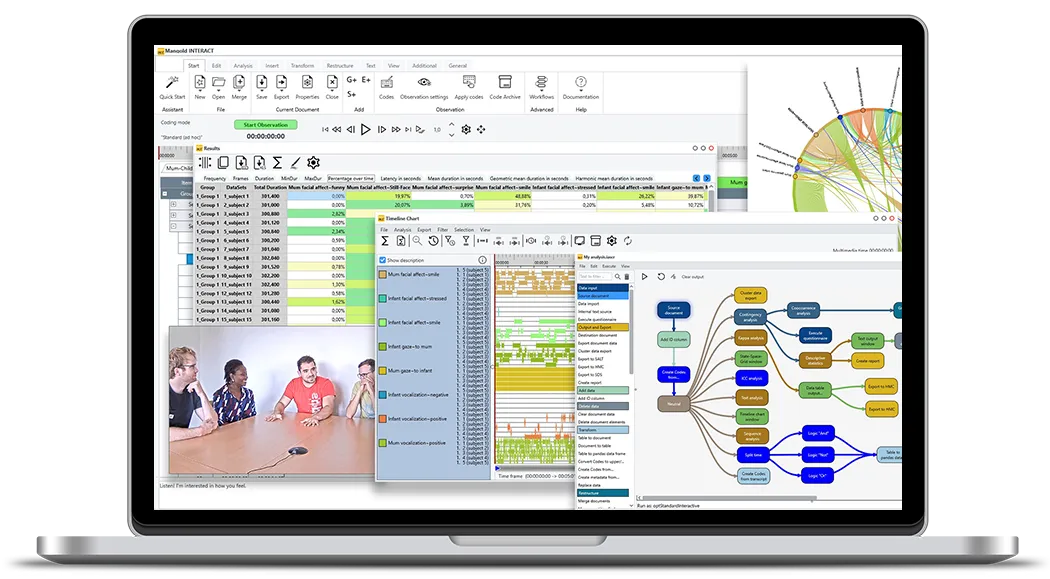
The tutorial begins with INTERACT’s fundamental statistical approach, where data entered into regular class columns instantly generates corresponding statistics. Using the pre-installed multi-purpose analysis demo file, you’ll explore how INTERACT handles complex data structures with multiple sessions, different trials, and various behavioral categories including Gestures, Emotions, and Talk behaviors across different subjects.
The core focus centers on the Statistics per Code reports, available in both detailed report format and cross-tabulated table format. The report format provides session-grouped data with comprehensive metrics including frequency counts, accumulated durations, minimum and maximum event durations, percentage coverage over time, behavioral latency measurements, and gap analysis statistics. The table format restructures this same data into easily readable cross-tables where each code becomes a column, making comparative analysis and data export significantly more straightforward.
Advanced statistical features include interval-based analysis capabilities, where you can examine what behaviors occur during specific states or time periods. The tutorial demonstrates how to analyze concurrent behaviors during specific events, such as examining all activities that occur while a subject is smiling. Time-based interval reporting allows for segmented analysis across defined time periods, providing insights into behavioral patterns over temporal segments.
The tutorial concludes with specialized reporting options including Class-based aggregated statistics, Code appearance order analysis, and metadata-based reporting capabilities. These tools provide researchers with comprehensive analytical frameworks for understanding behavioral data patterns, temporal relationships, and statistical distributions across different experimental conditions and participant groups.
INTERACT: One Software for Your Entire Research Workflow
From data collection to analysis—including GSEQ integration—INTERACT has you covered.