Product · 11 min read
DataView: Synchronize Sensor Measures with Video Recordings
Discover how Mangold DataView in combination with Mangold INTERACT transforms complex research data into deep insights through data exchange and integrated analysis.
What is Mangold DataView
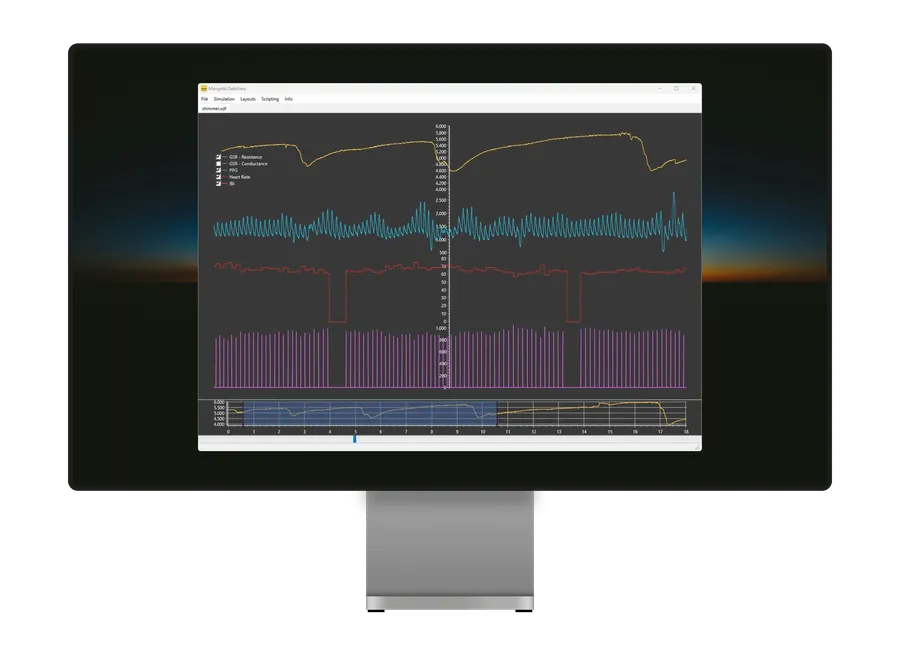
Mangold DataView is a specialized add-on software designed to enhance INTERACT ‘s capabilities by enabling the visualization and synchronization of sensor data alongside video recordings. As an integral part of the Mangold ecosystem, DataView transforms how researchers work with physiological and other sensor data in behavioral research.
DataView serves as the bridge between quantitative sensor measurements and qualitative behavioral observations in INTERACT. This integration enables researchers to:
- Synchronize various sensor data streams with video recordings
- Visualize physiological measurements alongside behavioral codes
- Examine visually what circumstances may have caused extreme measures
- Create a comprehensive view of research participants’ behaviors and physiological responses
Core Purpose and Benefits
The primary purpose of DataView is to enhance INTERACT-based research by:
- Enhanced Data Integration: Visualize and replay measured sensor data in sync with video recordings
- Unified Data Analysis: Combine behavioral observations with precise physiological measurements by creating Events based on channel data
- Enhanced Insights: Uncover relationships between observed behaviors and physiological responses
- Multi-Platform Support: DataView runs on both Windows and MacOS
- Multi-Instance Support: Run multiple instances of DataView for parallel analysis of different sources
- Network Communication: Synchronize multiple DataView instances across machines on a local network
Key Features
In combination with INTERACT, DataView offers the following key features:
Data Import and Format Support
DataView can import a range of data formats commonly used in research settings:
- Accepted Formats: EDF (European Data Format), BDF (Binary Data Format), CSV
- Versatile: Capable of handling data from various sensor systems with different frequencies
- Import Templates: Save configurations for repeated data imports
- Brain Products Integration: Specialized import of Brain Products EEG measures and markers
Visualization Capabilities
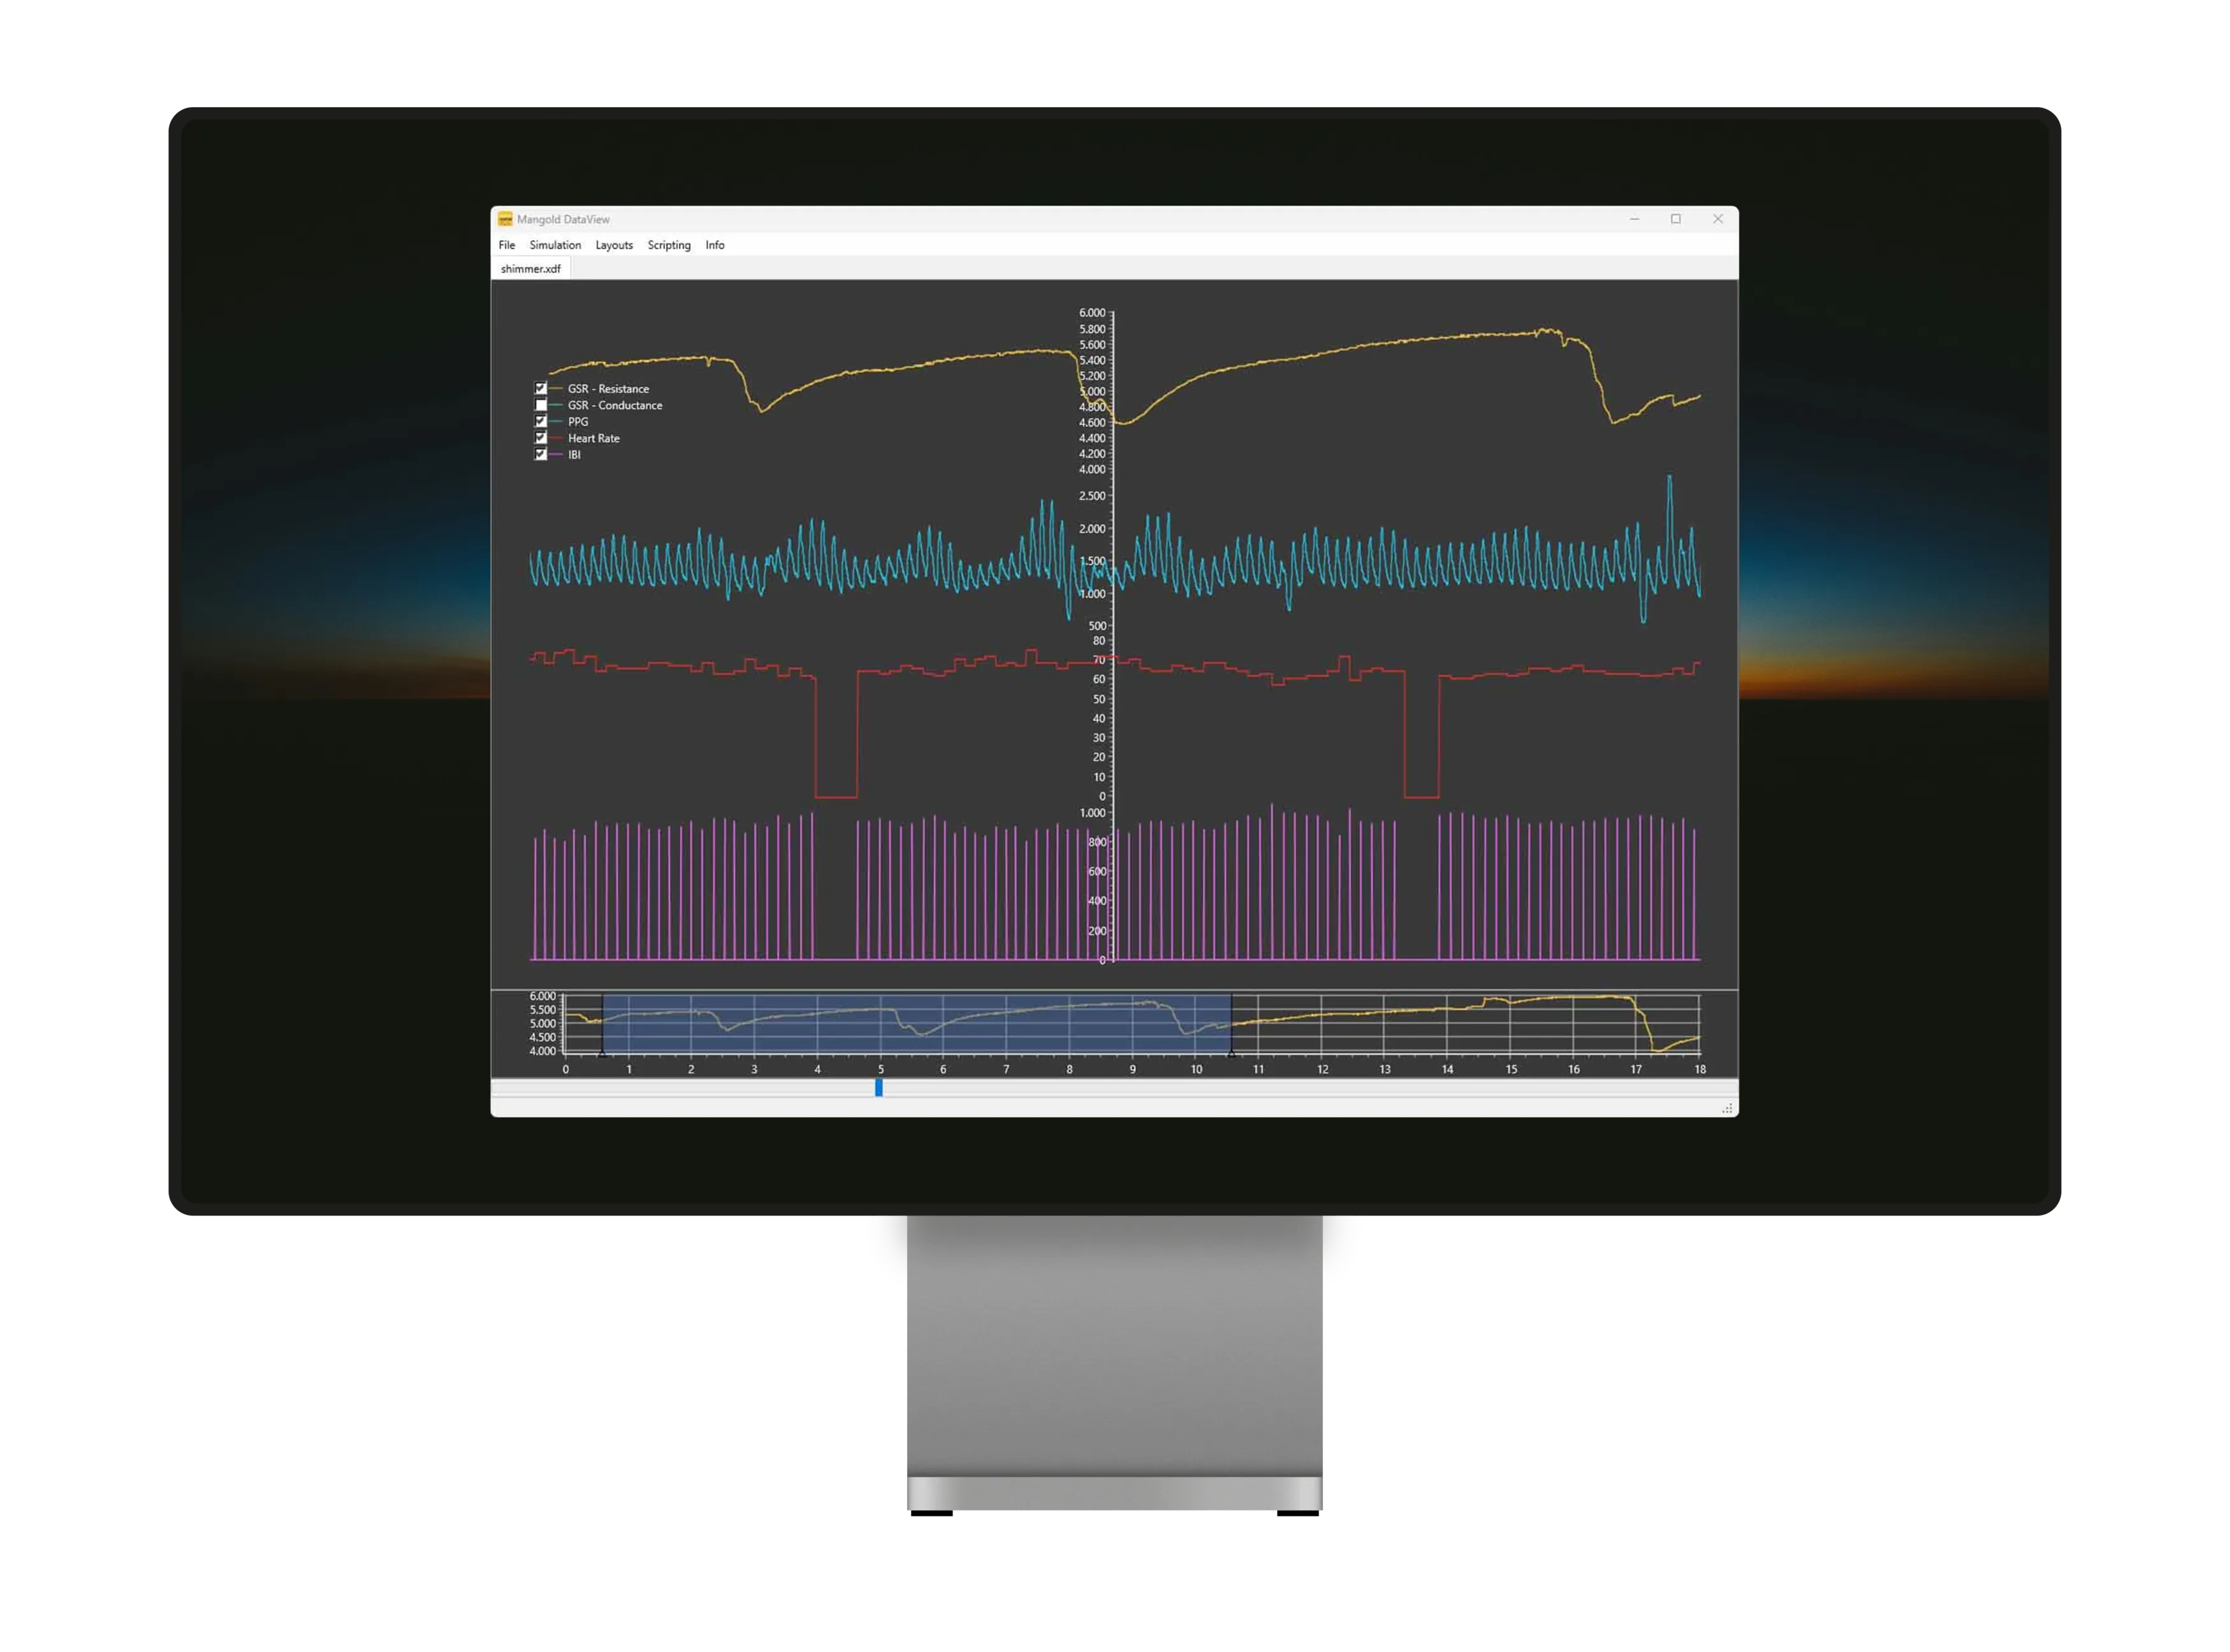
DataView provides a robust visualization that enables intuitive analysis of sensor data:
- Customizable Views:
- Create user-defined layouts for optimal data presentation
- Group related channels for organized visualization
- Adjust chart properties to fine-tune the content display
- Color-code channels for easy differentiation
- Synchronized Playback:
- View sensor data alongside video recordings in INTERACT
- Maintain millisecond-based temporal alignment
- Navigate through multiple data streams simultaneously
Enhanced Analysis Capabilities
When working with INTERACT, DataView enables:
- Combined Data Analysis:
- Create INTERACT events based on sensor data thresholds
- Transfer observational codes to measured data values
- View behavioral codes alongside physiological measurements
- Create pre- and post-events around auto-generated, value-based Codes
- Get complete INTERACT statistics on the channel speficic, value-based Codes generated by DataView
- Make use of the auto-generated, value-based Codes in any of the analysis routines like finding co-occurrences, contingencies, and latencies
Synchronization Options
DataView together with INTERACT provides flexible synchronization capabilities to handle various research scenarios:
- Multiple Recording Scenarios:
- Handle cases where video starts before or after sensor data
- Synchronize data from different recording systems
- Support for VideoSyncPro automated synchronization
- Fine-tune syncrhonization manually, if required.
- Precision Alignment:
- Frame-accurate synchronization with video
- Maintain temporal relationships across all data streams
- Compensate for different sampling rates
- Timeline Navigation:
- Use INTERACT’s timeline to navigate through synchronized sensor data
- Jump directly to specific events while maintaining synchronization
- View multiple data streams simultaneously
- Automatic Data Loading:
- Referenced sensor data loads automatically when analyzing video in INTERACT
- Maintains precise temporal relationships between all data sources
- Handles different recording start times and sampling rates
- Multi-Instance Support:
- Run multiple instances of DataView on one machine for parallel analysis of different sources
- Synchronize multiple DataView instances accross machines on a local network
Brain Products EEG Integration
DataView offers specialized support for Brain Products EEG systems:
- Loads Brain Product EDF export files
- Import Brain Products markers for synchronization
- Create INTERACT events based on EEG markers
EEG Study Example Video
The following tutorial demonstrates the powerful integration capabilities of Mangold INTERACT and DataView, specifically focusing on EEG studies combined with behavioral analysis. This comprehensive example showcases how researchers can synchronize multiple data streams including EEG recordings, video feeds, eye-tracking data, and behavioral observations.
The video illustrates the practical application of VideoSyncPro for precise synchronization and demonstrates how INTERACT and DataView work together to analyze complex, multi-modal research data. Whether you’re conducting neuroscience research, behavioral studies, or usability testing, this tutorial provides valuable insights into managing and analyzing synchronized physiological and behavioral data.
Applications Across Fields
The combination of INTERACT and DataView enables comprehensive research across numerous domains. Each field benefits from the platform’s ability to synchronize and analyze multiple data streams simultaneously:
Behavioral Research
- Combine physiological data with video recordings
- Analyze eye-tracking patterns alongside behavioral codes
- Study complex interaction patterns and corresponding physiological measurements
Medical Studies
- Track patient responses through multiple data channels
- Analyze treatment effectiveness with synchronized measurements
- Document procedural outcomes with integrated data
Simulation Analysis
- Visualize complex simulator data streams
- Track performance metrics across multiple parameters
- Evaluate training effectiveness through combined data analysis
Educational Research
- Correlate student engagement with physiological responses
- Analyze learning patterns through multiple measurements
- Evaluate teaching methods with comprehensive data
Tell us about your project
We'd love to hear about your research project and how Mangold DataView can help.
Working with Physiological Data
When conducting behavioral research, understanding physiological measurements provides crucial context for human responses and reactions. DataView enables researchers to visualize and analyze these vital measurements alongside behavioral observations in INTERACT, creating a comprehensive view of human behavior and physiological responses.
GSR - Galvanic Skin Response
Galvanic Skin Response (GSR), also known as Electrodermal Activity (EDA) or Skin Conductance Response (SCR), measures changes in the electrical conductance of the skin in response to various internal and external stimuli. This measurement serves as a window into emotional and psychological arousal states, making it particularly valuable for behavioral research.
The science behind GSR lies in the human skin’s sweat glands, which are controlled by the autonomic nervous system. When a person experiences stress, excitement, or anxiety, the sympathetic nervous system activates these sweat glands, leading to measurable changes in skin conductance. This connection between emotional state and physiological response makes GSR a powerful tool for understanding human behavior.
Key aspects that make GSR valuable for research include:
- Direct connection to emotional and psychological states
- Non-invasive measurement technique
- Rapid response to stimuli
When integrated with INTERACT through DataView, researchers can synchronize these physiological responses with observed behaviors, creating a richer understanding of human reactions. For example, a participant’s increased stress level might be detected through GSR before visible behavioral changes appear in the video recording.
HRV - Heart Rate Variability
Heart Rate Variability (HRV) analysis reveals the subtle variations in time intervals between successive heartbeats, providing deep insights into the autonomic nervous system’s function. This measurement goes beyond simple heart rate monitoring, offering a window into how the body responds to stress, emotion, and physical demands.
The autonomic nervous system operates through two primary branches, each playing a crucial role in HRV patterns. The sympathetic nervous system, responsible for our “fight or flight” response, increases heart rate and prepares the body for action. In contrast, the parasympathetic nervous system promotes rest and recovery, decreasing heart rate and supporting restorative functions.
Through DataView’s integration with INTERACT, researchers can observe these physiological patterns alongside behavioral data. This combination reveals valuable insights into:
Stress and Recovery Patterns: Understanding how participants’ bodies respond to and recover from challenging situations, visible through both behavioral cues and heart rhythm changes.
Emotional Regulation: Tracking the relationship between observed emotional responses and underlying physiological adaptation through HRV patterns.
Physical and Mental Load: Measuring the impact of various tasks and situations on both visible behavior and internal physiological state.
PPG - Photoplethysmography
Photoplethysmography represents a remarkable advancement in non-invasive physiological monitoring, using light to measure blood volume changes in tissue. This optical technique has become increasingly important in behavioral research, offering insights into cardiovascular responses without interrupting natural behaviors.
The principle behind PPG is elegantly simple yet powerful. By shining light into the tissue and measuring how much returns to the sensor, researchers can detect subtle changes in blood flow. These changes correspond to each heartbeat and provide valuable information about the cardiovascular system’s response to various stimuli and situations.
When integrated into behavioral studies through DataView and INTERACT, PPG data offers several unique advantages:
Real-Time Physiological Monitoring: Researchers can observe immediate cardiovascular responses while simultaneously coding behaviors in INTERACT. This synchronization helps identify how specific events or interactions affect physiological state.
Multiple Parameter Tracking: Beyond basic heart rate measurements, PPG provides insights into:
- Blood oxygen saturation levels
- Pulse rate variability
- Blood volume changes
- Respiratory patterns
IBI - Interbeat Interval
The InterBeat Interval measurement provides a precise window into the heart’s rhythm, revealing subtle variations that often correspond to psychological and physiological states. This measurement goes beyond simple heart rate monitoring, offering detailed insights into how the cardiovascular system responds moment by moment.
Understanding IBI patterns helps researchers identify subtle changes in physiological state that might not be immediately apparent through behavioral observation alone. Through DataView’s integration with INTERACT, these patterns can be precisely aligned with observed behaviors, creating a more complete picture of participant responses.
The value of IBI analysis in behavioral research becomes particularly apparent when examining:
Stress Response Patterns: Changes in IBI often precede visible stress behaviors, allowing researchers to identify triggering events and early response indicators. When synchronized with behavioral observations in INTERACT, these patterns reveal how individuals cope with and adapt to stressful situations.
Emotional Regulation: The heart’s rhythm reflects both conscious and unconscious emotional processing. By tracking IBI alongside behavioral codes, researchers can better understand the relationship between internal physiological regulation and external emotional expression.
EEG Integration through Brain Products
The integration of Brain Products EEG systems with DataView represents a significant advancement in comprehensive behavioral research. This capability allows researchers to synchronize neural activity data with behavioral observations, providing unprecedented insights into the relationship between brain activity and observable behaviors.
EEG measurements capture the brain’s electrical activity patterns, offering a direct window into cognitive processes and states. Through DataView’s specialized support for Brain Products systems, researchers can:
Capture Complex Neural Patterns: The brain’s electrical activity provides rich information about attention, emotional processing, and cognitive load. When synchronized with behavioral observations in INTERACT, these patterns help researchers understand the neural basis of observed behaviors.
Monitor Cognitive States: By combining EEG data with behavioral analysis, researchers can track how different cognitive states manifest in observable behaviors. This is particularly valuable in:
- Learning and memory studies
- Attention and focus research
- Emotional processing investigations
- Decision-making analysis
The practical implementation of EEG data through DataView maintains both temporal precision and signal quality, ensuring that researchers can rely on their measurements when drawing conclusions about behavior-brain relationships. This integration supports various research applications, from basic science investigations to applied clinical studies.
Practical Research Examples
Understanding how DataView enhances INTERACT-based research becomes clearer through real-world applications. Here are detailed examples of how researchers utilize this integrated approach across different fields.
Advanced Behavioral Research
Consider a study examining customer service interactions in a high-stress environment. By combining behavioral observations with physiological measurements, researchers gain deeper insights into both visible behaviors and internal responses.
A typical research setup might include:
- Video recording of service interactions
- Heart rate and GSR measurements of service providers
- Behavioral coding of customer and provider responses
Through DataView’s integration with INTERACT, researchers can observe how physiological stress responses align with specific interaction patterns. For example, they might discover that certain customer behaviors trigger elevated heart rates in service providers several seconds before any visible change in their professional demeanor appears.
The synchronized analysis reveals:
- Early warning signs of stress through physiological indicators
- Correlation between customer behaviors and provider responses
- Effectiveness of different coping strategies
- Patterns in recovery time after difficult interactions
This comprehensive approach helps organizations develop more effective training programs based on both observable behaviors and physiological responses.
Educational Assessment Studies
Modern educational research benefits significantly from the ability to synchronize multiple data streams. A typical study examining student engagement might combine traditional behavioral observations with physiological measurements to understand learning processes more deeply.
Classroom Interaction Analysis: Researchers can track student engagement through multiple channels:
Traditional behavioral indicators captured in INTERACT include:
- Active participation patterns
- Attention focus duration
- Peer interaction frequency
While DataView simultaneously monitors physiological responses:
- Heart rate variability during different activities
- Stress levels during presentations
- Attention patterns through EEG measurements
The combination reveals valuable insights about learning environments. For instance, researchers might discover that while some teaching methods appear to create high visible engagement, physiological measurements indicate elevated stress levels that could impede effective learning.
Clinical Research Applications
In clinical settings, the integration of DataView and INTERACT provides valuable insights for both research and treatment evaluation. Consider a therapy session analysis where understanding both observable behaviors and physiological responses is crucial.
Therapeutic Process Analysis: During therapy sessions, researchers can track:
Behavioral Indicators:
- Verbal expression patterns
- Non-verbal communication
- Emotional expression changes
Synchronized Physiological Responses:
- Heart rate variability during emotional discussions
- Skin conductance during exposure therapy
- Recovery patterns after challenging moments
This integrated approach helps clinicians:
- Identify effective therapeutic techniques
- Understand patient responses more comprehensively
- Track treatment progress objectively
- Adjust interventions based on both visible and physiological responses
Sports Performance Research
Sports science researchers benefit particularly from the synchronization capabilities of DataView and INTERACT. By combining video analysis of athletic performance with physiological data, researchers can develop deeper insights into performance optimization.
Performance Analysis Integration: A typical study might examine:
Technical Execution: Researchers use INTERACT to code specific movements, techniques, and strategic decisions during performance. Simultaneously, DataView can extract physiological parameters that might influence execution from seperately recorded sensor data:
- Cardiovascular response during high-intensity moments
- Recovery patterns between efforts
- Stress indicators during critical points
- Energy expenditure patterns
This combined analysis helps:
- Identify optimal performance conditions
- Develop more effective training programs
- Understand fatigue impacts on technique
- Create personalized recovery strategies
Through these practical examples, we see how the integration of DataView and INTERACT creates research opportunities that wouldn’t be possible otherwise. This comprehensive approach to data collection and analysis helps researchers develop deeper insights and more effective interventions across various fields.
Tell us about your project
We'd love to hear about your research project and how Mangold DataView can help.