Tutorial · 2 min read
Important Settings for Mangold INTERACT Software
A comprehensive tutorial on how to configure key settings in Mangold INTERACT to optimize your research workflow.
Introduction
Understanding the basic settings in INTERACT is crucial for efficient behavioral research and analysis. This tutorial guides both new and experienced researchers through the essential configuration options that optimize your workflow and ensure data integrity. Whether you’re setting up INTERACT for the first time or looking to fine-tune your existing setup, these settings will help you make the most of your research tools.
What You’ll Learn
- Configure language and backup settings to secure your workflow
- Customize time format displays for customized video timing
- Optimize statistical output formats for data export
- Manage zero values handling and color coding for improved data visualization
- Adjust main document layout settings for efficient coding
Tutorial Overview
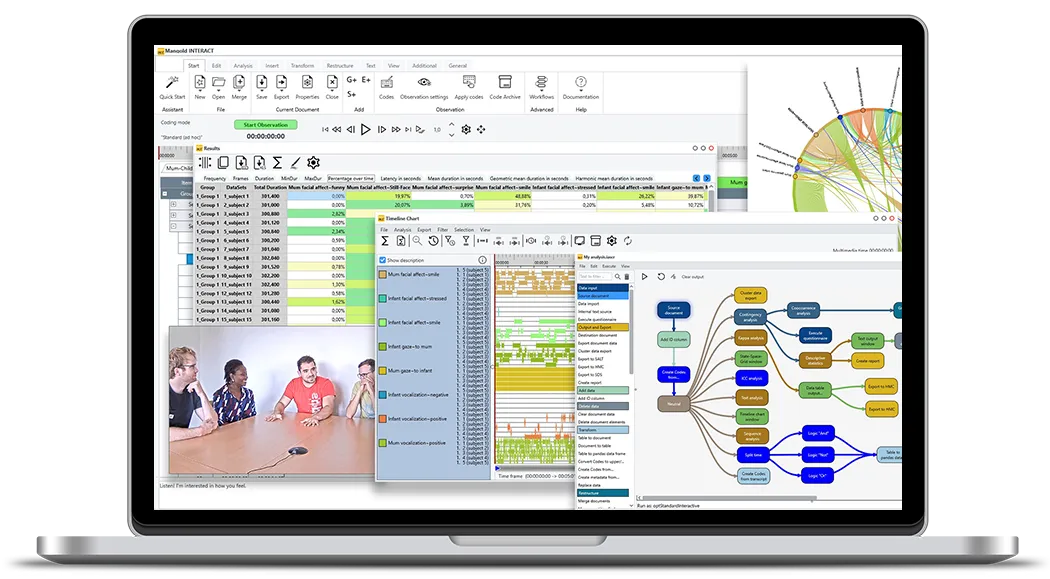
INTERACT’s program settings menu provides comprehensive control over the basic, program wide settings. The interface can be customized in several languages, making it accessible to international research teams. One of the most critical features is the automatic backup system, which ensures your work is continuously saved and protected against unexpected system failures.
Time format configuration is particularly important for video analysis. INTERACT offers flexible options for displaying time, including real timecode with video frames or milliseconds. Precision is related to the current number of frame per seconds, which is crucial for accurate behavioral coding and analysis. The software also supports extended time ranges, including historical data spanning thousands of years, making it versatile for various research applications.
Statistical output formatting is another key area where INTERACT excels. Users can customize the display of numerical data, including decimal precision and time formats, independently from the document settings. This flexibility is especially valuable when exporting data to other analysis tools like SPSS, R, or Excel. The ability to handle NULL values and customize their representation ensures compatibility with various data analysis workflows.
The visualization options within statistical results enhance data interpretation through strategic use of color coding the peaks per Code accross datasets and the different options for zero value handling. Researchers can toggle between different display modes to optimize readability and quickly identify patterns in their data. The main document layout can be customized to accommodate different research needs, particularly useful when working with transcripts and coded behaviors.
For detailed information on specific settings or advanced features not covered in this tutorial, we recommend consulting the online documentation using the search function.
INTERACT: One Software for Your Entire Research Workflow
From data collection to analysis—including GSEQ integration—INTERACT has you covered.